
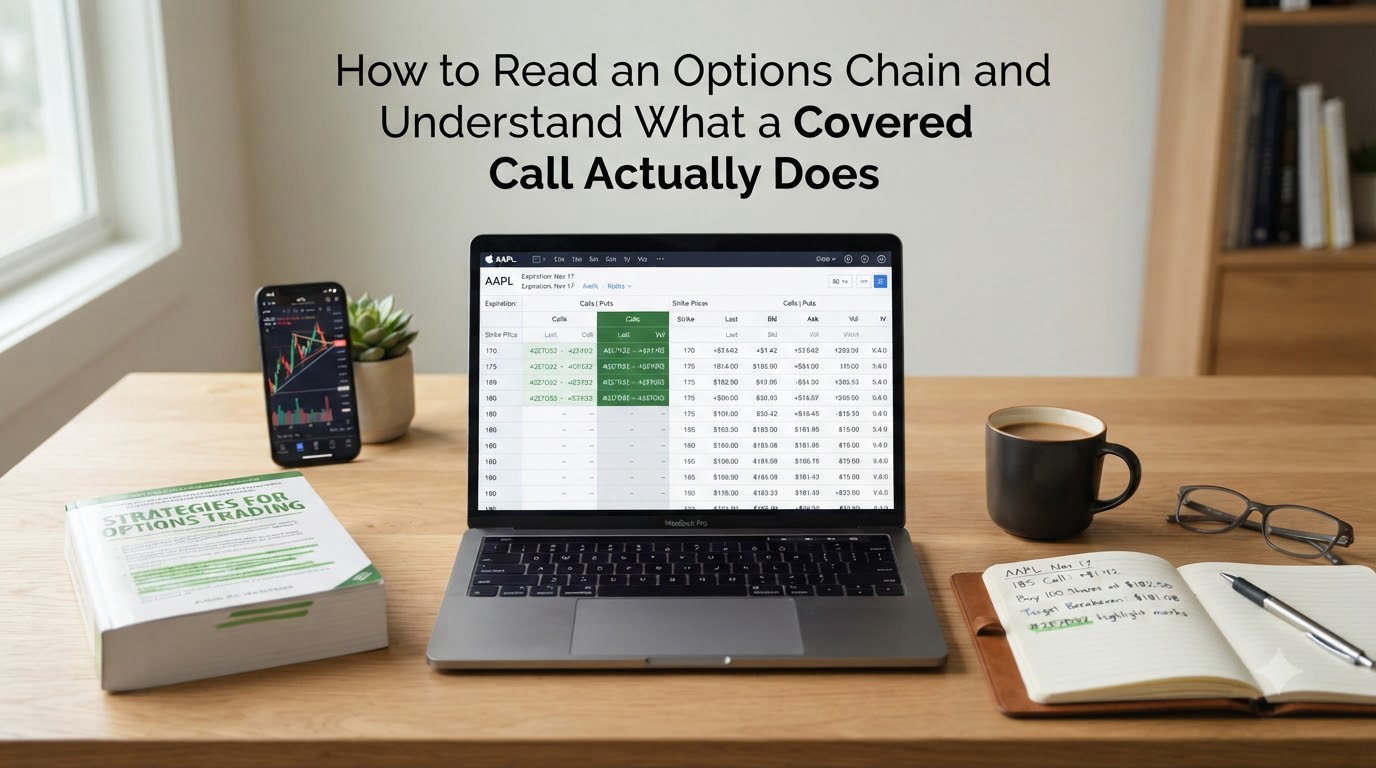
If you have ever stared at your broker’s options screen and felt your eyes glaze over, you are not alone. Learning how to read an options chain is the single biggest hurdle new options traders face, and it is also the skill that unlocks everything else, including the covered call strategy.
An options chain looks like a wall of numbers, but it follows a predictable structure. Once you understand a handful of columns and what they signal, you can scan dozens of contracts in seconds and know exactly which one fits your goal.
This guide walks you through every column on the chain in plain language, then explains what a covered call actually does, why investors sell them, and what happens to your shares if the trade goes against you. By the end, you will be able to open any option chain on Fidelity, Schwab, or Robinhood and read it with confidence.
Whether you want to generate monthly income from shares you already hold or simply decode the jargon your coworker keeps dropping at lunch, the concepts here apply directly. We will use real numbers, real ticker examples, and the same questions that flood Reddit’s r/options every week.
Table of Contents
What Is an Options Chain? A Plain-English Definition
An options chain is a table that lists every available call and put contract for a specific stock or ETF, organized by expiration date and strike price. Think of it as a menu: each row is a different contract you can buy or sell, and each column tells you something about that contract’s price, activity, and liquidity.
Brokers display the chain so you do not have to hunt for individual contracts one at a time. You pick a ticker, and the chain instantly shows you every strike, every expiration, current premiums, and trading volume in a single view.
The Options Clearing Corporation (OCC) standardizes these contracts, which means the layout is consistent regardless of which broker you use. The numbers change, but the structure stays the same.
The Two Halves of Every Chain: Calls and Puts
Every options chain splits into two sides: calls and puts. A call option gives the buyer the right to buy 100 shares of the underlying stock at a specific strike price before the expiration date. A put option gives the buyer the right to sell 100 shares at the strike price.
On most platforms, calls appear on the left half of the chain and puts on the right, with the strike prices running down the center. This mirrored layout lets you compare call and put premiums at the same strike side by side.
When you sell a covered call, you are working exclusively on the call side of the chain. The put side is irrelevant for this strategy, though understanding both halves helps you read the full picture.
One key distinction: as a call buyer, you pay a premium for the right to buy shares. As a call seller (which is what a covered call involves), you collect that premium and take on an obligation to sell your shares if the buyer exercises.
How the Chain Is Organized on Your Screen
The chain organizes contracts by expiration date first, then by strike price within each expiration. At the top, you typically see a row of date selectors, tabs, or a dropdown menu listing every available expiration cycle, from this week to two years out.
When you click an expiration date, the chain expands to show every strike price available for that date. Strikes usually center around the current stock price, with intervals of $1, $2.50, $5, or larger depending on the stock’s price and liquidity.
Many beginners do not realize the chain shows many expirations at once. You might see weekly expirations stacked on top of monthly ones. On most platforms, you can filter to show only the dates you care about, which clears the clutter fast.
Here is a simplified example of what a small section of a call-options chain might look like for a stock trading at $100:
| Strike | Last | Bid | Ask | Volume | Open Int. |
|---|---|---|---|---|---|
| $95 | $7.10 | $7.00 | $7.20 | 1,240 | 5,830 |
| $100 | $3.25 | $3.20 | $3.30 | 3,560 | 12,400 |
| $105 | $1.05 | $1.00 | $1.10 | 2,100 | 8,920 |
Each row represents one contract at one strike. The columns give you everything you need to evaluate it.
Color Coding and What Those Backgrounds Mean
Most broker platforms use color to highlight whether a contract is in-the-money or out-of-the-money. On Schwab, Fidelity, and similar platforms, in-the-money calls typically get a shaded or highlighted background so you can spot them instantly.
For calls, any strike below the current stock price is in-the-money (ITM), meaning the option already has intrinsic value. Any strike above the current price is out-of-the-money (OTM), meaning it is purely extrinsic value based on time and volatility.
This color coding saves you from doing mental math on every row. If the stock trades at $100 and you see green shading on the $95 strike call, you immediately know that contract is ITM.
Some platforms also highlight the at-the-money (ATM) strike, which is the one closest to the current stock price. The ATM strike usually has the highest volume and open interest, making it a natural starting point for beginners.
How to Read an Options Chain, Column by Column?
Reading an options chain means understanding five core groups of data: strike price, expiration date, pricing columns (bid, ask, last, change), activity columns (volume and open interest), and moneyness (ITM vs OTM). Each group tells you something different about whether a contract is worth trading.
Strike Price: What It Means and How to Choose
The strike price is the price at which the option holder can buy (for calls) or sell (for puts) the underlying shares. It is the single most important variable in any options trade because it determines your breakeven, your potential assignment price, and your premium.
For covered calls, the strike price sets the price at which you agree to sell your shares. If you own 100 shares of a stock trading at $100 and sell a call at the $105 strike, you are agreeing to sell those shares at $105 if the buyer exercises.
Lower strikes pay higher premiums because they are more likely to be exercised. Higher strikes pay less premium but give your stock more room to run before shares get called away. This is the central tradeoff of every covered call, and we will dig into it with real numbers later.
When choosing a strike, ask yourself: at what price would I be happy selling this stock? If you would gladly sell at $105, that strike is a candidate. If selling at that price would make you unhappy, pick a higher strike or skip the trade.
Expiration Date and Days to Expiration (DTE)
The expiration date is the last day the contract exists. After that date, the option expires worthless (if OTM) or is automatically exercised (if ITM for American-style options). Most equity options are American-style, meaning they can be exercised any time before expiration, not just on the expiration date.
Days to expiration (DTE) measures how long the contract has left to live. A contract with 30 DTE has a month of time value baked into its premium, while a contract with 5 DTE has much less time value remaining.
Time decay, also called theta, erodes an option’s extrinsic value as expiration approaches. This decay accelerates in the final weeks, which is why many covered call sellers prefer 30 to 45 DTE contracts: they capture meaningful premium while the time decay works in their favor.
Shorter-dated contracts (7 to 14 DTE) offer faster time decay but smaller premiums and less room to manage the position if the stock moves. Longer-dated contracts (60+ DTE) offer larger premiums upfront but tie up your shares for months and decay more slowly.
Most covered call income strategies target the 30 to 45 DTE range. It balances decent premium collection with manageable assignment risk and gives you the flexibility to roll or close the position if circumstances change.
Bid, Ask, Last, and Change
These four columns tell you about the contract’s current pricing. The last price is the most recent traded price. The change column shows how much the last price moved from the previous day’s close. Both are useful for context but not for execution.
The two columns that matter most for actually placing a trade are the bid and the ask. The bid is the highest price a buyer is willing to pay right now. The ask is the lowest price a seller is willing to accept right now.
Reddit users on r/options constantly ask about the bid/ask spread, and the simplest explanation is this: the bid is what you can sell for, and the ask is what you can buy for. The difference between them is the spread, and you want that spread to be narrow.
When you sell a covered call, you typically sell at the bid (or use a limit order between the bid and ask). A wide spread means you might lose money to slippage just entering and exiting the trade. As a rule of thumb, avoid contracts where the spread exceeds 10 percent of the option’s price.
High-volume, high-open-interest contracts tend to have tight spreads of just a penny or two. Illiquid contracts on less popular strikes or expirations can have spreads of $0.20 or more, which eats into your returns.
Volume and Open Interest: Liquidity Signals
Volume shows how many contracts traded today. Open interest shows how many contracts are currently open and outstanding. Both are critical for liquidity, but they measure different things.
Volume resets to zero each trading day. It tells you how active a contract is right now. A contract with 5,000 contracts of volume today is actively traded and likely has a tight bid/ask spread.
Open interest accumulates over the life of the contract. It tells you how many positions exist. High open interest means many traders are involved, which generally translates to better fills and easier entry and exit.
I look for both numbers to be in the hundreds at minimum, preferably in the thousands. A contract with volume of 3 and open interest of 12 is a ghost town; you will struggle to get a fair price entering or exiting.
The at-the-money strike in the nearest monthly expiration almost always has the highest volume and open interest. If you are new to this, start there and expand outward as you gain confidence.
In-the-Money vs Out-of-the-Money Explained
Moneyness describes whether an option has intrinsic value. For calls, a contract is in-the-money when the stock price is above the strike. It is out-of-the-money when the stock price is below the strike.
ITM call options cost more because they already have value: if the stock trades at $105 and the strike is $100, the contract has $5 of intrinsic value built in. OTM calls are cheaper because they only have extrinsic value, which is based purely on time and volatility expectations.
This directly affects premium pricing. An ITM covered call at the $95 strike on a $100 stock pays a large premium, but it also means your shares are very likely to get called away, since the stock would have to drop below $95 for the contract to expire worthless. You are trading income for a high probability of selling your shares.
An OTM covered call at the $110 strike pays less premium, but the stock has to rise above $110 for assignment to happen. Your shares are more likely to stay put, but you collect less income.
For beginners, starting with slightly out-of-the-money strikes (one or two strikes above the current price) is usually the safest approach. You collect meaningful premium while giving your shares room to appreciate.
What a Covered Call Actually Does?
A covered call is an options strategy where you sell call options against shares you already own. You collect a cash premium upfront, and in exchange, you agree to sell your shares at the strike price if the option buyer exercises. That is the entire mechanic, and understanding it deeply is the key to using the strategy well.
The word “covered” means you own the underlying shares. If the option gets exercised, you simply hand over the shares you already hold. This stands in contrast to a naked call, where you sell a call without owning the stock and face theoretically unlimited risk.
Covered Call Definition in Simple Terms
Imagine you own 100 shares of a stock worth $100 per share. You think the stock will stay flat or rise modestly over the next month. You sell one call contract at the $105 strike, expiring in 35 days, and collect a $200 premium.
That $200 is yours to keep no matter what happens. If the stock stays below $105, the option expires worthless and you keep both your shares and the premium. If the stock rises above $105, you sell your shares at $105 per share and still keep the premium.
The covered call turns a stock you already hold into an income-generating asset. Instead of just waiting for price appreciation, you collect rent on your position every month.
How Covered Calls Work, Step by Step
Here is the exact sequence of events when you sell a covered call:
Step 1: Own 100 shares. You must own at least 100 shares of the underlying stock in your account because one option contract represents 100 shares. If you own 300 shares, you can sell up to 3 contracts.
Step 2: Open the options chain. Navigate to the stock’s options chain in your broker platform. Select an expiration date, typically 30 to 45 days out. Choose a strike price above the current stock price.
Step 3: Sell to open. Choose “sell to open” on the call contract you selected. This creates your short call position. You can use a market order for speed or a limit order to control your fill price.
Step 4: Collect the premium. The premium hits your account as a cash credit the next business day. This money is yours regardless of how the trade resolves.
Step 5: Monitor and manage. Watch the position as expiration approaches. If the stock is below your strike, you can let it expire worthless and sell another call. If the stock is above your strike, your shares will likely be called away at expiration.
Step 6: Roll or accept assignment. If you do not want to sell your shares, you can “roll” the call by buying it back and selling a new one at a later expiration or higher strike. Otherwise, assignment happens automatically for ITM options at expiration.
The Covered Call Risk and Reward Profile
A covered call has a defined maximum gain and a defined, substantial downside risk. Your maximum profit is the premium collected plus any stock appreciation up to the strike price. Your maximum loss occurs if the stock drops to zero, reduced by the premium you collected.
For example, if you sell a $105 call on a $100 stock and collect $200 in premium, your maximum profit is $700: $500 from stock appreciation ($100 to $105 on 100 shares) plus $200 in premium. Your breakeven drops to $98 per share because the premium cushions a $2 decline.
The premium you collect provides a small cushion against downside moves. If the stock drops from $100 to $98, you have not lost money yet because the $200 premium offsets the $200 in stock depreciation.
The main risk is not losing money on a decline. It is opportunity cost. If the stock rockets from $100 to $130, you still sell at $105. You forfeit $25 per share of upside in exchange for $2 per share of premium. That is the trade you agreed to.
This is why covered calls work best on stocks you expect to stay flat or rise modestly. On a slow grind upward, the strategy enhances your returns. On a sharp rally, it caps your gains.
ITM vs OTM Covered Calls: The Core Tradeoff
Where you place your strike determines whether you run an aggressive or conservative covered call. This is a topic that competitors often gloss over, but forum users ask about it constantly.
ITM covered calls (strike below stock price) offer higher premiums and greater downside protection, but a very high probability of assignment. You are essentially pre-committing to sell your shares at a discount to the current price, and the premium compensates you for that commitment.
ATM covered calls (strike at or near stock price) offer the highest extrinsic value of any strike. This means the most time decay in your favor, making them popular with income-focused sellers who plan to let contracts expire or roll them frequently.
OTM covered calls (strike above stock price) offer smaller premiums but let you capture additional upside on your shares before assignment happens. The further out-of-the-money you go, the less premium you collect but the more room your stock has to run.
Here is a side-by-side comparison for a stock trading at $100 with 30 days to expiration:
| Strike | Moneyness | Premium | Assignment Odds | Downside Cushion |
|---|---|---|---|---|
| $95 | ITM | $6.00 | High | Large |
| $100 | ATM | $3.20 | Moderate | Medium |
| $105 | OTM | $1.20 | Lower | Small |
Notice how premium shrinks as you move further out-of-the-money. You are being paid less because the stock has to travel further for assignment to occur.
A Covered Call Example With Real Numbers
Theory is useful, but real numbers make the concept click. Let us walk through a complete covered call trade from start to finish using realistic prices and two different outcomes at expiration.
Say you own 200 shares of a blue-chip stock trading at $50 per share. You want to generate some extra income without selling your shares outright. You open the options chain and look at the call side.
Choosing Your Strike and Expiration
You select an expiration 35 days out. Looking at the chain, the $50 call (at-the-money) is bid at $1.50. The $52 call is bid at $0.65. The $55 call is bid at $0.15.
You decide on the $52 strike because it gives you $2 of upside on the stock before assignment, plus $0.65 per share in premium. That means your effective sell price if assigned would be $52.65 ($52 strike plus $0.65 premium), which is a 5.3 percent gain over 35 days.
You sell 2 contracts (matching your 200 shares) at the $52 strike for $0.65 each. That puts $130 in your account: $0.65 times 100 shares times 2 contracts.
That $130 is yours regardless of what happens next. The question is simply whether you also sell your shares.
Two Outcomes at Expiration
Outcome A: The stock stays at $50 or below. The call expires worthless. You keep your 200 shares and the $130 premium. Your cost basis on the stock has dropped from $50 to $49.35 per share. You can now sell another call for the next expiration cycle and repeat the process.
Outcome B: The stock rises to $54. The call is in-the-money at expiration. Your shares are called away at $52 per share. You receive $52 per share from the sale (instead of the $54 market price), but you keep the $0.65 premium. Your total return per share is $2.65 ($2 stock gain plus $0.65 premium), or 5.3 percent in 35 days.
In Outcome B, the stock kept going to $54 and you missed out on $2 per share of additional gain. That is the opportunity cost of the covered call. You traded $2 of upside for $0.65 of guaranteed income.
Neither outcome is a disaster. In Outcome A, you earned income on a flat stock. In Outcome B, you sold at a profit and earned premium. The strategy underperforms only if the stock explodes upward, and even then, you still made money.
When to Use Covered Calls
Covered calls shine in specific market conditions. The best time to sell them is when you expect your stock to move sideways or rise modestly, not when you expect a sharp rally.
Schwab outlines three core use cases that align with how experienced sellers actually deploy this strategy. First, as a gradual exit strategy: if you want to sell a long position slowly, selling calls slightly above the current price lets you collect premium while reducing your average exit price.
Second, for income generation on a stock you plan to hold: if you own a dividend-paying stock and have no intention of selling, covered calls layer additional income on top of the dividend. You can potentially earn dividends plus option premiums plus modest price appreciation.
Third, in tax-advantaged accounts like IRAs, where you can generate income without triggering short-term capital gains taxes on each premium collection. Many brokers allow covered call writing inside IRAs because the strategy is defined-risk and collateralized by your shares.
Covered calls are not ideal when you expect a big move in either direction. If the stock crashes, the small premium barely offsets the loss. If the stock rockets, you cap your gains. The sweet spot is a flat to slightly bullish stock in a flat to slightly bullish market.
Dividend Dates and Early Assignment Risk
This is the topic that generates the most confusion on forums, and it deserves a clear explanation. If you sell a covered call and the stock goes ex-dividend before expiration, you face early assignment risk.
Here is why: a call buyer who exercises just before the ex-dividend date captures the dividend. If your call is in-the-money and the dividend exceeds the remaining time value of the option, a rational buyer will exercise early to grab the dividend.
If that happens, your shares get called away the day before the ex-dividend date. You lose the shares and miss the dividend payment. You still keep the premium you collected, but you forfeit the dividend you were counting on.
To avoid this, avoid selling deep in-the-money calls on dividend-paying stocks near ex-dividend dates. If your call is out-of-the-money, early assignment is extremely unlikely because the buyer has no reason to exercise early. Keep your strikes above the stock price around dividend dates, and you largely avoid this risk.
If you want to hold the stock for the dividend, do not sell a call with a strike that could go in-the-money before the ex-dividend date. It is that simple.
Risks and Considerations Before You Sell
Covered calls are one of the most conservative options strategies, but they are not risk-free. Understanding the risks before you place your first trade prevents costly surprises.
Assignment Risk and What Happens When Shares Get Called Away
Assignment is the process where the option buyer exercises their right and your shares are sold at the strike price. For American-style options, this can happen any business day before expiration, not just at expiration.
In practice, early assignment is rare for out-of-the-money calls. It becomes a real risk only for deep in-the-money calls, especially around ex-dividend dates as explained above.
If your shares are called away, the transaction settles like any stock sale. You receive the strike price per share, and your broker removes the shares from your account. The premium you already collected is unaffected.
For many covered call sellers, assignment is not a bad outcome. If you chose a strike at a price you were happy to sell at, assignment simply means you achieved your target exit price plus extra premium income.
Opportunity Cost: Capping Your Upside
The biggest risk of covered calls is not losing money. It is leaving money on the table. When you sell a call, you agree to sell your shares at the strike price, which means any appreciation beyond that price goes to the option buyer, not you.
If you sell a $105 call on a $100 stock and the stock jumps to $150 on a buyout announcement, you still sell at $105. You forfeit $45 per share of upside in exchange for whatever premium you collected.
This is why covered calls suit investors who are comfortable with a defined exit price. If you hold a stock because you believe it will double, selling covered calls works against your thesis. If you hold a stock for steady income and modest growth, covered calls complement your goal.
A simple rule: never sell a covered call at a strike price where you would regret selling. If $105 is a price you can live with, sell the call. If it is not, pick a higher strike or do not sell.
Common Mistakes Beginners Make
The most common mistake is chasing the highest premium without understanding why it is high. A fat premium usually means high implied volatility, which means the market expects big price swings. High premiums are a warning sign, not a gift.
Another frequent error is selling calls on stocks you do not want to sell. If you are emotionally attached to a position or believe in long-term upside, assignment will frustrate you. Match the strategy to your conviction level.
Beginners also tend to ignore the bid/ask spread. Selling a low-liquidity contract with a wide spread can cost you 5 to 10 percent of your premium to slippage alone. Stick with high-volume strikes and expirations.
Finally, many new sellers forget about commissions and fees. Each contract sale and buyback costs money, which eats into your premium. Factor these costs into your expected return before placing the trade.
FAQs
How to understand covered calls?
A covered call is a strategy where you sell a call option on shares you already own. You collect a cash premium upfront, and in exchange you agree to sell your shares at a specific strike price if the option buyer exercises. If the stock stays below the strike, you keep your shares and the premium. If it rises above the strike, your shares get called away at that price and you still keep the premium.
How to read and interpret option chain?
An option chain lists every available call and put contract for a stock, organized by expiration date and strike price. Start by selecting an expiration date. Then read across each row: the strike price is your buy or sell price, the bid is what you can sell the option for, the ask is what you pay to buy it, volume shows today’s trading activity, and open interest shows how many contracts are outstanding. Focus on the bid, ask, volume, and open interest columns to assess liquidity before placing any trade.
How to read a covered call chart?
A covered call risk chart shows your profit or loss across different stock prices at expiration. The line rises diagonally from left to right as the stock price climbs toward your strike, then flattens out at the strike price because your gains are capped. Below the strike, your loss is cushioned by the premium you collected. The flat portion of the line represents your maximum profit, and the breakeven point is your stock purchase price minus the premium received.
Does Warren Buffett use covered calls?
Warren Buffett has used options strategies including covered calls and cash-secured puts through Berkshire Hathaway, though they represent a tiny fraction of his overall portfolio. Buffett is better known for selling long-dated put options on major indices. For individual investors, covered calls are a mainstream income strategy approved by most brokers and commonly used in retirement accounts.
Wrapping Up: Your Next Steps
Learning how to read an options chain and understanding what a covered call actually does gives you a practical income tool you can deploy on stocks you already own. The chain is just a structured menu of contracts, and the covered call is simply selling someone else the right to buy your shares at a price you choose.
Start by opening the options chain on a stock you hold and reading the call side column by column. Find the nearest expiration 30 to 45 days out, identify the at-the-money strike, and compare premiums at nearby strikes. You do not need to place a trade to practice reading the data.
When you are ready, sell your first covered call on a small position at a strike you would be happy to sell at. Track the premium, watch how time decay erodes the option’s value, and experience the mechanics firsthand. The concepts make far more sense once you see them play out on your own screen.