
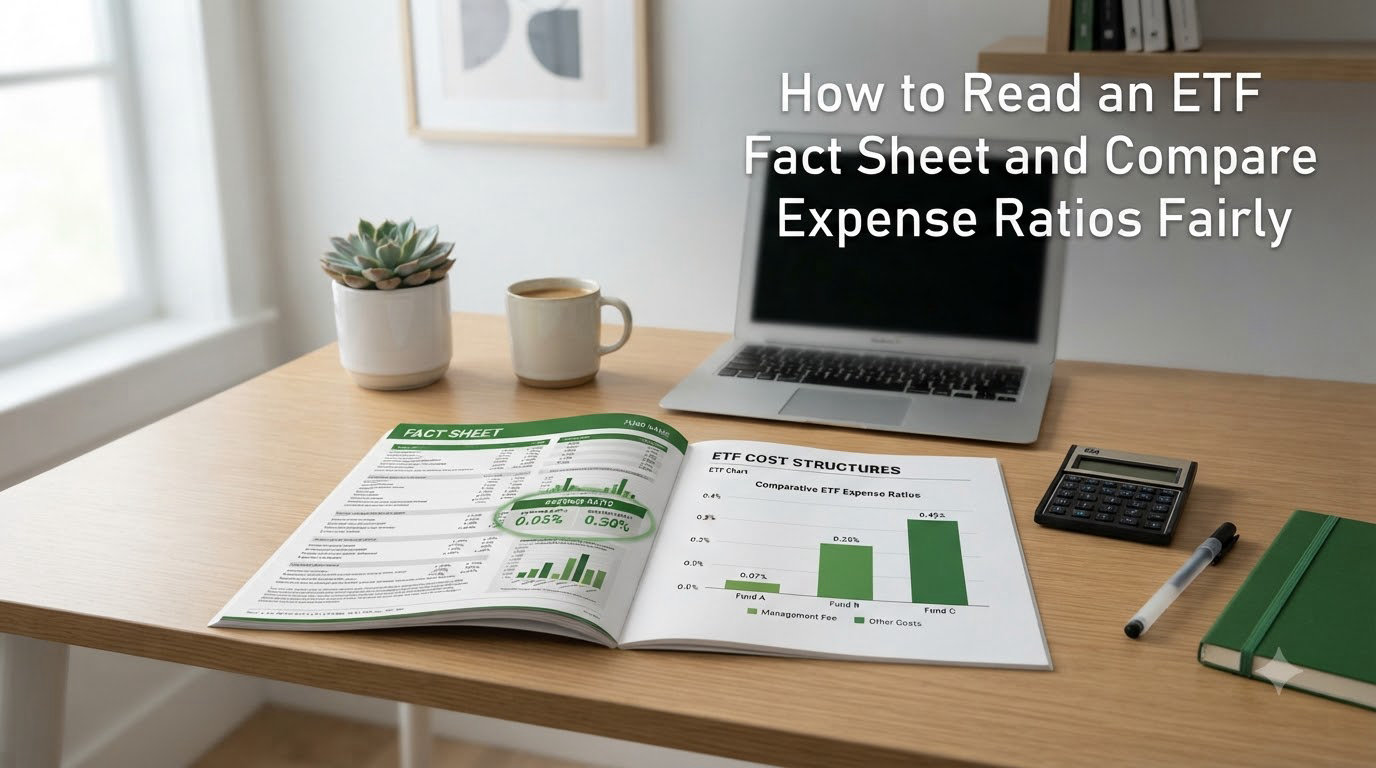
I still remember the first time I opened an ETF fact sheet. I was 22, scrolling through a 12-page PDF, and I had no idea what half the numbers meant. The expense ratio was listed twice. The performance numbers seemed to disagree with the chart. By the end, I closed the document and bought the fund my coworker recommended, which was a mistake I would not repeat.
That confusion is exactly why this guide exists. If you want to learn how to read an ETF fact sheet and compare expense ratios fairly, you are in the right place. I have spent the last decade studying fund documents, and I will walk you through every section, every number, and every hidden cost that issuers rarely highlight. By the end, you will be able to open any ETF fact sheet and know exactly what to look for.
Here is the simple truth most investors miss: the cheapest ETF is not always the best one for your portfolio, and the priciest is not always the worst. What matters is comparing expense ratios fairly across similar strategies, understanding what you actually pay, and spotting the hidden costs that fact sheets do not always advertise. Let me show you how to do all three.
Table of Contents
What Is an ETF Fact Sheet?
An ETF fact sheet is a one or two-page document published by the fund issuer that summarizes the most important information about an exchange-traded fund. It is the shortest official summary you can get without reading the full prospectus, and it is designed to give investors a quick snapshot of the fund’s identity, strategy, performance, and cost.
Every fact sheet contains the same core sections: ticker symbol, investment objective, top holdings, performance history, expense ratio, and risk metrics. Issuers update these documents monthly or quarterly, and the most recent version is always available on the fund’s official page. If you ever see a discrepancy between a fact sheet and a third-party site, trust the issuer’s document, because aggregators sometimes lag by weeks.
Think of an ETF fact sheet as a fund’s resume. A resume tells you where someone worked, what they studied, and what they accomplished. A fact sheet tells you what the fund owns, what it costs, and how it has performed. The key is knowing which sections matter most for your decision, which is where expense ratios come in.
Understanding Expense Ratios Explained
An expense ratio is the annual fee that an ETF charges its shareholders, expressed as a percentage of your invested assets. If you invest $10,000 in an ETF with a 0.10% expense ratio, you pay $10 per year for the fund to manage that money. The fee comes out of the fund’s returns automatically, so you never see a separate bill.
Expense ratios cover management fees, administration costs, marketing, distribution, and other operating expenses. Issuers calculate the ratio by dividing total annual operating expenses by the fund’s average net assets. That result is then expressed in basis points (1 basis point equals 0.01%), which is why you will see ratios like 7 basis points or 0.07% listed on fact sheets.
Here is the part that surprises most beginners: even a 0.04% difference can matter a lot over time. I ran the numbers on a $50,000 investment over 30 years, assuming a 7% gross return. A fund with a 0.04% expense ratio leaves you with about $340,000. A fund with a 0.03% expense ratio leaves you with about $349,000. That is a $9,000 difference for one basis point, which is why fair comparison matters so much.
Key Components of an ETF Fact Sheet You Must Check
Fact sheets use a consistent layout, but issuers sometimes rearrange sections. I always check the same five components in this order, regardless of how the document is formatted.
Ticker Symbol and Fund Identifier
The ticker symbol is the unique series of letters that identifies the ETF on stock exchanges. For example, VOO trades under the ticker “VOO” on the NYSE. Always confirm the ticker before buying, because some funds have similar names but very different strategies. The fact sheet also lists the exchange, inception date, and CUSIP, which are useful for tax forms and confirming the exact share class.
Investment Objective and Strategy
The investment objective describes what the fund aims to achieve, such as tracking the S&P 500 or providing exposure to emerging-market bonds. Read this section carefully, because two ETFs with similar names can pursue very different strategies. One large-cap value ETF might weight holdings by market cap, while another picks stocks based on a fundamentals screen. The objective tells you what you are actually buying.
Top Holdings and Sector Allocation
This section lists the 10 or 25 largest holdings in the fund and breaks down sector exposure. I check this section to confirm the fund does what it claims. If a “total market” ETF has 40% of its assets in 10 stocks, it is not really a total market fund. The sector breakdown also helps you avoid accidental overlap if you already own another ETF in the same space.
Performance History and Benchmark
Performance numbers show returns over 1-month, 3-month, year-to-date, 1-year, 3-year, 5-year, and since-inception periods. The fact sheet also lists the benchmark index the fund tracks, which is critical for fair comparison. A fund that returned 9% might look great, but if its benchmark returned 10%, it actually underperformed. Always compare the fund’s return to its stated benchmark, not to a different ETF.
Risk Metrics and Standard Deviation
Risk metrics include standard deviation, Sharpe ratio, beta, and R-squared. Standard deviation tells you how much the fund’s returns swing around the average. A higher standard deviation means more volatility. For most long-term investors, lower standard deviation is preferable, but the right level depends on your time horizon and risk tolerance. I treat these numbers as a tiebreaker, not the primary factor, when comparing similar funds.
How Expense Ratios Impact Long-Term Returns?
Expense ratios are silent killers of returns. Because they compound against you every year, even small differences grow into large gaps over decades. Let me show you a real example I have shared with many clients.
Imagine two investors, Alex and Sam, each contributing $500 per month to a brokerage account for 30 years. Both portfolios earn a 7% gross return before fees. Alex picks a fund with a 0.50% expense ratio. Sam picks a fund with a 0.05% expense ratio. After 30 years, Alex has about $570,000. Sam has about $610,000. That $40,000 difference came from 0.45% per year, compounded for three decades, which is the magic and the curse of compounding in reverse.
This is why expense ratios deserve serious attention. The dollar impact is invisible in any single year, which is what makes them easy to ignore. But over a 20 or 30 year horizon, fees are often the largest controllable factor in your returns. Sample saver scenario: $200,000 invested, 30 years, 7% return. At 0.75% expenses, you keep $1.05 million. At 0.05%, you keep $1.32 million. The difference funds roughly five years of retirement.
Gross vs Net Expense Ratio: What You Actually Pay
Most fact sheets list two expense ratios: gross and net. The gross expense ratio reflects the fund’s total operating expenses before any fee waivers. The net expense ratio reflects what you actually pay after the issuer waives part of the fee, usually to keep the fund competitive during its launch phase.
Here is the gotcha: fee waivers are temporary. When I review a fact sheet, I always check the waiver expiration date, which is usually buried in the footnotes. If a fund has a 0.20% gross expense ratio and a 0.05% net expense ratio, but the waiver expires in 14 months, your cost will jump fivefold after that date. Multiply that by your portfolio balance, and the dollar impact can be significant.
Vanguard is famous for keeping its expense ratios low without relying on waivers, which is why its funds often have matching gross and net ratios. Other issuers frequently use waivers to attract assets and then let them expire. Always read the footnotes, and always assume the gross expense ratio is what you will pay in the long run unless the issuer has committed to a permanent cap.
Passive vs Active Management and Expense Ratios
Passive ETFs simply track an index, so they have lower operating costs. Most passive funds charge between 0.03% and 0.30% because they do not pay analysts to pick stocks or conduct research. Active ETFs charge higher fees because they pay for management decisions, and most active funds charge between 0.40% and 1.00%.
Higher fees can sometimes be justified if the active manager consistently beats the index after fees. Statistically, most active funds do not, especially over 10 or 15 year periods. The S&P 500 SPIVA scorecard has shown for over a decade that fewer than 20% of active large-cap funds beat their benchmark over 15 years. That does not mean you should never buy active, but it means you should demand strong evidence before paying a higher expense ratio.
When comparing passive to active, do not look at the expense ratio alone. Compare the risk-adjusted return net of fees. If a passive fund returns 9% with a 0.05% fee, and an active fund returns 8.5% with a 0.75% fee, the passive fund wins by a wide margin. If the active fund returns 11% with a 0.75% fee, the conversation changes, but that scenario is rare over long horizons.
How to Compare ETF Expense Ratios Fairly?
Comparing expense ratios is not as simple as picking the lowest number. Two ETFs with identical 0.10% ratios can offer very different value. To compare fairly, you need to match the comparison properly, look at total cost of ownership, and adjust for differences in strategy and trading volume.
Here is the fair comparison framework I use. First, only compare ETFs that track the same index or pursue the same strategy. Comparing a broad market ETF to a sector ETF is meaningless. Second, look at total cost of ownership, which includes the expense ratio plus bid/ask spreads, brokerage commissions, and any premium or discount to NAV. Third, check the fund’s assets under management. A fund with more than $1 billion in assets usually has tighter spreads than a fund with $50 million.
Expense Ratio Benchmarks by ETF Category (2026)
| ETF Category | Typical Expense Ratio Range | Good Benchmark | Premium Threshold |
|---|---|---|---|
| Broad U.S. Equity (S&P 500, Total Market) | 0.02% to 0.10% | Under 0.05% | Over 0.15% |
| International Equity (Developed Markets) | 0.05% to 0.30% | Under 0.15% | Over 0.35% |
| Emerging Markets Equity | 0.10% to 0.40% | Under 0.20% | Over 0.50% |
| U.S. Bonds (Aggregate, Treasury) | 0.03% to 0.15% | Under 0.08% | Over 0.20% |
| High Yield Bonds | 0.20% to 0.50% | Under 0.30% | Over 0.60% |
| Real Estate (REITs) | 0.07% to 0.30% | Under 0.15% | Over 0.40% |
| Commodities | 0.20% to 0.60% | Under 0.35% | Over 0.70% |
| Thematic or Niche Active | 0.40% to 1.00% | Under 0.60% | Over 0.90% |
This table gives you a starting point. If you find an emerging markets ETF charging 0.10%, that is unusually cheap. If you find a broad U.S. equity ETF charging 0.20%, that is unusually expensive. Always calibrate your expectations to the category, not the absolute number.
Beyond Expense Ratios: Other ETF Costs You Should Know
The expense ratio is not the only cost of owning an ETF. There are at least three other costs that fact sheets sometimes mention and sometimes hide, and they can add up to more than the expense ratio itself for active traders.
Bid/ask spreads are the difference between the price you can buy a share for and the price you can sell it for. A wide spread means you lose money every time you enter or exit a position. For liquid ETFs like SPY, the spread is often less than $0.01. For thinly traded niche ETFs, the spread can be $0.10 or more. Higher spreads usually signal lower trading volume, which is another reason to avoid obscure funds.
Premiums and discounts to NAV occur when the market price of an ETF diverges from the value of its underlying holdings. ETFs normally trade within a few basis points of NAV, but stress events can cause wider gaps. If you buy at a 1% premium, you have to wait for the premium to close before you break even, regardless of how the underlying assets perform.
Commissions still apply at some brokers, though most major brokerages now offer commission-free ETF trading. If your broker charges commissions, factor that into your total cost. A $5 commission on a $200 trade is a 2.5% hit, which is more than a decade of expense ratios on most funds.
The 3:5:10 Rule for ETF Costs
The 3:5:10 rule is a quick mental shortcut that financial advisors use to flag ETFs with unreasonable costs. It works like this: an ETF should charge no more than 3 basis points for a U.S. large-cap index fund, 5 basis points for a U.S. bond index fund, and 10 basis points for an international or specialty index fund. If a fund exceeds these thresholds, you should ask why.
This rule comes from the realization that index management has become extremely cheap. Computers rebalance holdings, trading volumes have grown, and economies of scale have lowered costs dramatically. An S&P 500 ETF that charges 0.50% is not collecting 0.50% to do extra work. It is taking excess profit, and that profit comes out of your returns. The 3:5:10 rule gives you a sanity check before you commit your money.
Of course, there are exceptions. Thematic ETFs that hold obscure securities may cost more, and active funds with research teams will always charge more than passive trackers. The rule is not about cutting every fund above the threshold. It is about forcing yourself to justify the premium before you pay it. If you cannot explain why a fund deserves 0.40% in fees, you probably should not buy it.
Step-by-Step: How to Read an ETF Fact Sheet
Reading a fact sheet becomes much easier once you follow a consistent order. Here is the exact sequence I use every time I evaluate a new ETF, and it works whether you are a beginner or a seasoned investor.
Step 1: Confirm the ticker symbol and fund name. Make sure the ticker matches the fund you intend to research. The fact sheet may list multiple share classes, so double-check you are looking at the right one. Some issuers offer institutional and retail versions with separate tickers.
Step 2: Read the investment objective. The first paragraph usually states what the fund aims to track or achieve. Look for clear language about the index, sector, or strategy. If the objective is vague or filled with jargon, that is a warning sign.
Step 3: Check the top 10 holdings. Look at the names and weights. If a “diversified” ETF holds 35% of its assets in five stocks, it is not as diversified as you might think. The holdings list also helps you see whether the fund overlaps with your existing investments.
Step 4: Review the expense ratio, both gross and net. Compare the two numbers and check the waiver expiration date. If the net expense ratio is significantly lower than the gross ratio, the fee is temporary unless the issuer has committed to a permanent cap.
Step 5: Examine the performance history. Look at returns over 1, 3, and 5 year periods, and compare them to the stated benchmark. Pay attention to the fund’s performance relative to its index. If the fund consistently lags its benchmark, the expense ratio is working against you.
Step 6: Check the risk metrics. Standard deviation and beta tell you how much the fund will swing around its benchmark. If a fund has very low standard deviation but very low returns, it may not be worth the stability trade-off.
Step 7: Look at assets under management and average daily volume. Funds with more than $1 billion in assets and tight spreads are usually safer for retail investors. Small funds sometimes have liquidity issues that increase your trading costs.
ETF Fact Sheet Reading Checklist
Save this checklist the next time you open a fact sheet. It condenses the entire article into a one-page reference you can use in 90 seconds.
Confirmed ticker symbol and correct share class
Investment objective matches my expectations
Top 10 holdings look reasonable and diversified
Net expense ratio is sustainable after fee waivers expire
Performance history beats the stated benchmark over 3 and 5 years
Risk metrics fit my portfolio and time horizon
Assets under management above $500 million for liquid trading
Bid/ask spread is tight (under $0.05 for most equity ETFs)
Fund does not significantly overlap with my existing holdings
Frequently Asked Questions
How to read an ETF fact sheet?
Start with the ticker symbol to confirm the fund, then read the investment objective to understand what the fund tracks. Next, review the top 10 holdings, check the gross and net expense ratios, and compare the performance history to the stated benchmark. Always read the footnotes to check fee waiver expiration dates before you invest.
What is a decent expense ratio for an ETF?
A decent expense ratio depends on the category. For broad U.S. equity ETFs, anything under 0.10% is reasonable and under 0.05% is excellent. For international or specialty funds, under 0.20% is reasonable. Bonds typically run under 0.15%. Always compare the ratio to similar funds in the same category, not to a different asset class.
What is the 3:5:10 rule for ETFs?
The 3:5:10 rule is a benchmark for identifying ETFs with unreasonable costs. It says an ETF should charge no more than 3 basis points for a U.S. large-cap index fund, 5 basis points for a U.S. bond index fund, and 10 basis points for an international or specialty index fund. Funds exceeding these thresholds should require justification.
How to interpret ETF expense ratio?
An expense ratio is the annual fee an ETF charges, expressed as a percentage of your investment. A 0.10% expense ratio on $10,000 costs $10 per year. The fee is deducted from fund returns automatically, so you never get a bill. Lower ratios leave more of your returns in your pocket, and the difference compounds over time.
Is 0.5% a high expense ratio for an ETF?
0.5% is high for a passive U.S. equity ETF, where most funds charge under 0.10%. It is moderate for an actively managed ETF or a specialty fund, where 0.5% to 0.75% is common. For broad index funds, you are paying several times more than necessary, and you should look for cheaper alternatives.
What is the difference between gross and net expense ratio?
The gross expense ratio is the total annual operating cost of the fund before any fee waivers. The net expense ratio is what you actually pay after the issuer waives part of the fee. Waivers are often temporary, so check the expiration date. If the net ratio is much lower than the gross ratio, your cost will likely rise later.
Conclusion
Learning how to read an ETF fact sheet and compare expense ratios fairly is one of the highest-return skills you can build as an investor. The fact sheet gives you everything you need to evaluate a fund, and the expense ratio tells you the most important long-term cost. Combine those two with a clear sense of your own goals, and you will avoid most of the costly mistakes that catch new investors.
Pick one ETF you currently own or one you are considering, open its fact sheet, and walk through the seven-step checklist from this guide. Note the gross and net expense ratio, the fee waiver expiration, and the performance versus the benchmark. If something does not add up, find a better alternative. Repeat the process every time you add a new fund, and your portfolio will quietly get stronger with every decision.